The bar graph shows the number of new residents in several towns during the years 1999 to 2001. Use the graph to answer the question. 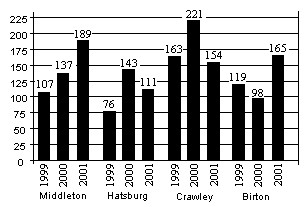 During the period 1999-2001, how many more new residents were there in Crawley than in Hatsburg?
A. 199
B. 182
C. 208
D. 186
Answer: C
Mathematics
You might also like to view...
Solve the problem.Find the derivative of the function  at the point
  in the direction in which the function increases most rapidly.
A. 

B. 

C. 

D. 

Mathematics
Evaluate the expression using the order of operations.(8 + 4)2
A. 68 B. 144 C. 80 D. 24
Mathematics
If an argument reads
p?q q?r r?s then we can conclude not s?_______________ . Fill in the blank(s) with the appropriate word(s).
Mathematics
Find an equation for the line with the given properties.Perpendicular to the line 5x - y = 6; containing the point (0,  )
)
A. y =  x +
x + 
B. y = -  x + 6
x + 6
C. y = -  x +
x + 
D. y = 1
Mathematics