Plot and interpret the appropriate scatter diagram.The table shows the study times and test scores for a number of students. Draw a scatter plot of score versus time treating time as the independent variable.  Effect of Study on Test Score
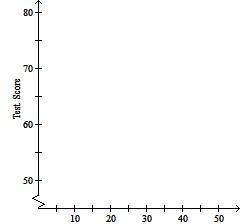 Time (min)
A. Effect of Study on Test Score
| Time (min) |
test scores.
B. Effect of Study on Test Score
| Time (min) |
test scores.
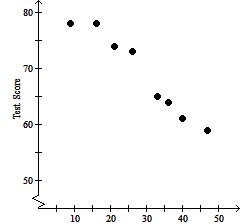
C. Effect of Study on Test Score
| Time (min) |
test scores.
D. Effect of Study on Test Score

| Time (min) |
test scores.
Answer: C
Mathematics
You might also like to view...
Graph the exponential function.y =  x
x
A. 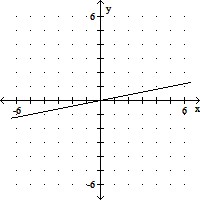
B. 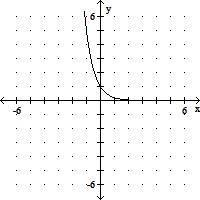
C. 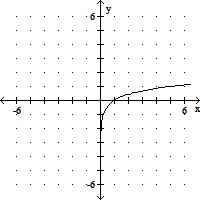
D. 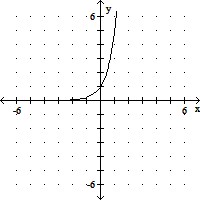
Mathematics
Find percent notation.0.128
A. 12.8% B. 0.0128% C. 128% D. 0.128%
Mathematics
Find two different Hamilton paths for the given graph.
A. A ? C ? H ? I ? G ? B ? D ? E ? F ; A ? C ? H ? I ? G ? B ? D ? F ? E B. D ? E ? F ? I ? G ? B ? A ? C ? H ; H ? C ? B ? A ? G ? I ? F ? E ? D C. The graph does not have two different Hamilton paths. D. C ? A ? B ? D ? E ? C ? H ? I ? G ; A ? C ? H ? I ? G ? B ? D ? E ? F
Mathematics
Solve the problem.Doctor Jim has the following aged patients at his clinic: 15, 1, 21, 15. What is the average age of his patients?
A. 13 B. 21 C. 1 D. 12
Mathematics