The total cost of producing one unit of output is $200; two units cost $300, three units $450, and four units $800. Fixed cost is $50. Draw the associated total cost, average cost, and marginal cost curves, placing total cost on one graph and marginal and average cost on a second graph.
What will be an ideal response?
Figure 8-6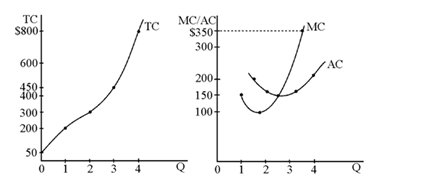
?
You might also like to view...
When a firm is experiencing diseconomies of scale, it should
A. expect its average total cost to increase if it reduces the scale of its operations. B. expect its average total cost to decrease if it reduces the scale of its operations. C. lower its price to attract new consumers. D. expect its average total cost to remain unchanged if it changes the scale of its operations.
Which of the following is considered to be a variable cost of operating an automobile?
a. insurance b. taxes c. car loan payment d. tires e. license and registration fees
What factors are held constant along a given demand curve for a good?
a. the price of the good b. the technology used to produce the good c. the supply of the good d. consumer incomes and the prices of other goods
In which of the following markets do firms sell the same standardized product?
A. Four-door cars B. Desktop computers C. 2% milk D. Sandwiches