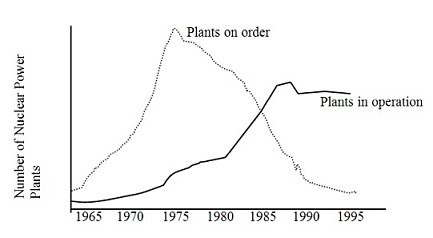
 Why didn't the "plants in operation" curve in the diagram increase to the same level that the "plants on order" curve peaked?
A. Because of the increased concerns about reactor safety and waste disposal
B. Because some people were still supportive of nuclear power
C. Because there is a lag time between ordering and operating a nuclear plant
D. Because nuclear power does not contribute to the greenhouse effect
E. Because many utilities cancelled their orders
Answer: E
You might also like to view...
Which of the following is the BEST indicator of the actual amount of water vapour in the air?
A. saturation vapour pressure B. dew point temperature C. relative humidity D. air temperature
________ is a nonrenewable resource.
A. Scientific technology B. Biomass C. Coal D. Solar energy E. Hydroelectric power
Map topology in ArcGIS mainly works with coincident lines between features. What does it mean by coincident lines between features?
What will be an ideal response?
What is the difference between a terminal (end) moraine and a recessional moraine? What will be an ideal response?