The figure below illustrates a tariff. On the graph, Q represents quantity and P represents price.
Figure 17-11
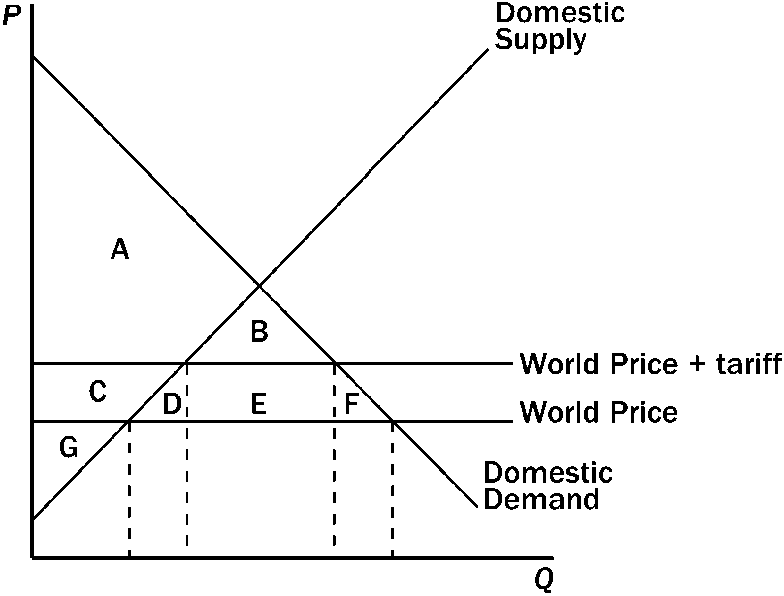
Refer to Figure 17-11. Government revenue raised by the tariff is represented by the area
a.
E.
b.
B + E.
c.
D + E + F.
d.
B + D + E + F.
a
You might also like to view...
U.S. Gross Domestic Product (GDP) does NOT include which of the following?
A) the value of goods produced in a foreign country by U.S. owned firms B) the purchase of all final goods and services by U.S. households C) U.S. exports to other countries D) business investment in the United States
The above figure shows the marginal benefits and marginal costs of a college education. The efficient number of students is
A) 0. B) 10 million. C) 15 million. D) 25 million.
Suppose the Fed reduces the reserve ratio from 0.25 to 0.20 and the current level of demand deposits is $10,000 . By how much would excess reserves change?
a. Excess reserves would increase by $2,500. b. Excess reserves would increase by $2,000. c. Excess reserves would decrease by $500. d. Excess reserves would increase by $500. e. Excess reserves would increase by $4,500.
When the economy experiences a prolonged recession, the percent of the population who are unemployed 27 weeks of longer:
A. decreases. B. increases. C. may increase or decrease. D. does not change.