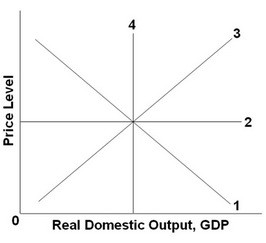
 Refer to the above graph. The aggregate demand curve would be represented by which line?
A. 1
B. 2
C. 3
D. 4
Answer: A
You might also like to view...
Use the following table to answer the next question.Total ProductTotal Fixed CostTotal Variable Cost0$150$0115050215075315010541501455150200615027071503608150475915062010150800Based on the cost data given, which of the following price-quantity tables correctly represents the firm's short-run supply schedule?(1)(2)(3)(4)PQsPQsPQsPQs$201$200$200$203302300300304453454450455604605600606755756755757956957956958120712081207120915081509150815010
A. Table (1) B. Table (2) C. Table (3) D. Table (4)
If a union negotiates a wage above the market equilibrium, each firm's
a. supply of labor is greater than its marginal resource cost b. supply of labor is less than its marginal resource cost c. supply of labor is equal to its marginal resource cost d. demand for labor is less than its marginal resource cost e. demand for labor is greater than its marginal resource cost
In the arena of trade policy, the battle often seems to be between ________ laws that increase protectionism and ________ agreements that try to reduce protectionism.
a. national; national b. international; international c. national; international d. international; national
socialism
What will be an ideal response?