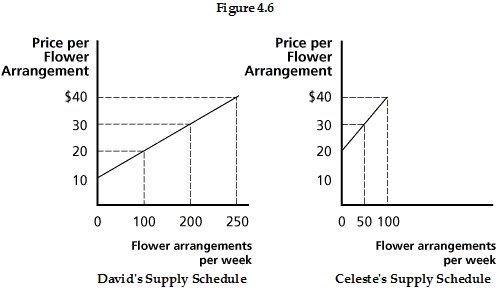
 Refer to Figure 4.6, which shows David's and Celeste's individual supply curves for flower arrangements per week. Assuming David and Celeste are the only producers in the market, if the market quantity supplied is 50, the price must be:
A. $0.
B. $10.
C. between $10 and $20.
D. $30.
Answer: C
You might also like to view...
A measure of growth in the standard of living is the growth in
A) population. B) real GDP minus the growth in population. C) real GDP. D) employment. E) population minus the growth in real GDP.
Why might governments choose to dispense with the market mechanism for directing development? What problems will arise?
What will be an ideal response?
The Clayton Act was passed, in part, to strengthen the Sherman Act.
Answer the following statement true (T) or false (F)
Refer to the information provided in Table 19.4 below to answer the question(s) that follow.Table 19.4Total IncomeTotal Taxes$10,000 $1,000 20,000 2,400 30,000 4,500 40,000 8,000Related to the Economics in Practice on page 393: Refer to Table 19.4. At an income level of $20,000, the average tax rate is
A. 1.2%. B. 8.3%. C. 12%. D. 24%.