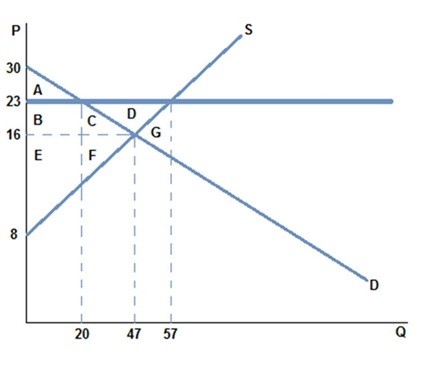
 The graph shown best represents:
A. a market for an inferior good.
B. a non-binding price floor.
C. a non-binding price ceiling.
D. a missing market.
Answer: C
You might also like to view...
Two countries, A and B, produce Good X. Which of the following statements is true of the trading price of Good X?
A) The trading price of Good X is less than the opportunity cost of producing the good in both nations. B) The trading price of Good X is greater than the opportunity cost of producing the good in both nations. C) The trading price of Good X lies between the opportunity costs of producing the good in both nations. D) The trading price of Good X is always equal to the opportunity cost of producing the good in Country A.
Suppose the working-age population of a fictional economy falls into the following categories: 90 are retired or homemakers; 60 have full-time employment; 20 have part-time employment; 20 do not have employment, but are actively looking for
employment; and 10 would like employment but do not have employment and are not actively looking for employment. The official unemployment rate as calculated by the U.S. Bureau of Labor would equal A) (20/80 ) × 100. B) (20/60 ) × 100. C) (30/80 ) × 100. D) (20/100 ) × 100.
When the errors are heteroskedastic, then
A) WLS is efficient in large samples, if the functional form of the heteroskedasticity is known. B) OLS is biased. C) OLS is still efficient as long as there is no serial correlation in the error terms. D) weighted least squares is efficient.
Refer to the information provided in Figure 20.1 below to answer the question(s) that follow.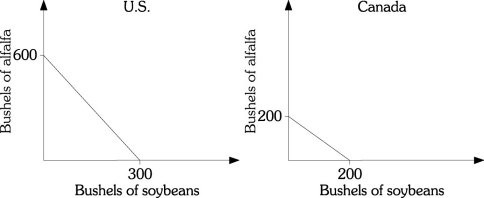 Figure 20.1Refer to Figure 20.1. Which of the following statements is true?
A. Only the United States should produce alfalfa. B. Only Canada can benefit from trade. C. Both countries should produce both products. D. Only Canada should produce alfalfa.