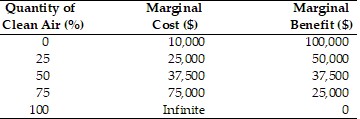
 The above table shows marginal costs and marginal benefits of clean air in a particular industrial area. In the table, when the quantity of clean air is at 75 percent
A. the marginal benefit of clean air exceeds the marginal cost.
B. the quantity of polluted air is 75 percent.
C. the quantity of clean air is optimal.
D. the marginal benefit of clean air is less than the marginal cost.
Answer: D
You might also like to view...
The figure above represents the production possibilities frontier for a country. a) The nation is currently producing at point B and wants to move to point C
What is the opportunity cost of the move? b) The nation is currently producing at point B and wants to move to point A. What is the opportunity cost of the move?
Perfectly competitive firms respond to changing market conditions by varying their
a. price b. output c. market share d. information e. advertising campaigns
Which of the following will reduce the risk of equity (stock) investments?
A) The purchase of shares of a mutual fund that holds the stocks of many diverse corporations. B) All of the above. C) The purchase of shares in firms doing business in a wider variety of industries and markets. D) The purchasing and holding of equities over a lengthy period of time.
The largest single source of revenue for the federal government is
A. Social Security payroll taxes. B. Personal income taxes. C. Corporate income taxes. D. Excise taxes.