Refer to the diagram. An increase in quantity supplied is depicted by a:
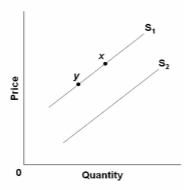
A. move from point y to point x.
B. shift from S 1 to S 2 .
C. shift from S 2 to S
D. move from point x to point y.
A. move from point y to point x.
You might also like to view...
The above figure shows the market for finish carpenters in Bozeman. If there is a minimum wage set at $18, then there will be
A) unemployment of 200 workers. B) a surplus of 200 workers. C) unemployment of 400 workers. D) a surplus of 400 workers. E) no unemployment of workers and no surplus of workers.
When its marginal cost increases, a firm aiming at maximizing net revenue
A) can always raise its price, but only by the amount of the cost increase. B) can often raise its price by more than the cost increase. C) can raise its price, but always by less than the cost increase. D) may not be able to raise its price at all.
The market will produce ________ level of education when we ________ its external benefits.
A. more than an efficient; do not consider B. more than an efficient; do consider C. an efficient; do not consider D. less than an efficient; do not consider
Refer to the graph shown. Which point has an elasticity greater than 1?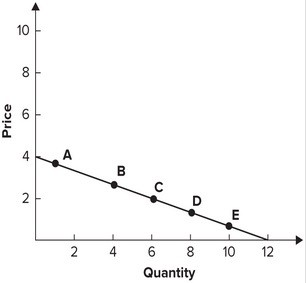
A. E B. B C. C D. D