Exhibit 6-1 Business cycle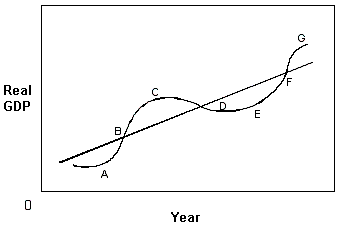
In Exhibit 6-1, point E represents:
A. recession and a trough.
B. peak and a trough.
C. recession and a peak.
D. recovery and a peak.
Answer: A
You might also like to view...
A time-series graph
A) shows how a variable changes over time. B) uses bars rather than lines. C) shows points in a scatter diagram. D) is similar to a cross-section graph because both can show trends over time. E) is in the shape of a pie.
The table above gives the production and prices for a small nation that produces only bread and soda. The base year is 2010. What is real GDP in 2010?
A) $530 B) $1080 C) $510 D) $210 E) $300
The demand for a specific brand of corn flakes cereal is likely to be:
A. very price elastic, because there are many close substitutes available. B. less price elastic, because there are many close substitutes available. C. very price elastic, because that specific brand is a unique product. D. less price elastic, because the specific brand is a unique product.
According to the labor statistics of the United States, the _____ reported the highest unemployment rate between 1960 and 2008
a. Whites b. Asians c. African Americans d. Hispanics e. Latinos