Solve the problem.The following scatter diagram shows heights (in inches) of children and their ages.Height (inches) Age (years)What is the expected height range for a 2-year old child?
A. 35-45 inches
B. 40-50 inches
C. 25-38 inches
D. 20-30 inches
Answer: C
You might also like to view...
Complete the table and use it to calculate the indicated relative frequency. Round your answer to three decimal places if necessary.The following table displays the age, in years, and sex for the residents of a retirement home.Age (years)?60-69 70-79 Over 79 Total Male5? 5 5? Female15?6? 4? Total????What is the relative frequency for persons in the age group 60-69?
A. 0.5 B. 0.667 C. 0.25 D. 0.333
Solve the problem.The owner of a video store has determined that the profits P of the store are approximately given by 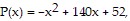 where x is the number of videos rented daily. Find the maximum profit to the nearest dollar.
A. $4900 B. $9852 C. $9800 D. $4952
Evaluate the expression.P(9, 0)
A. 725,760 B. 1 C. 362,880 D. 0.5
Find the standard-form equation of the ellipse.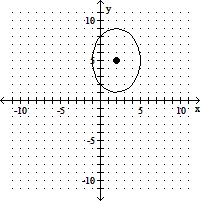
A.  +
+  = 1
= 1
B.  +
+  = 1
= 1
C.  +
+  = 1
= 1
D.  +
+  = 1
= 1