Use a graphing utility to graph the function over the indicated interval and approximate any local maxima and local minima. Determine where the function is increasing and where it is decreasing. If necessary, round answers to two decimal places.f(x) = x3 - 4x2 + 6; (-1, 4)
A. local maximum at (0, 6)
local minimum at (2.67, -3.48)
increasing on [0, 2.67]
decreasing on [-1, 0] and [2.67, 4]
B. local maximum at (2.67, -3.48)
local minimum at (0, 6)
increasing on [-1, 0] and [2.67, 4]
decreasing on [0, 2.67]
C. local maximum at (0, 6)
local minimum at (2.67, -3.48)
increasing on [-1, 0] and [2.67, 4]
decreasing on [0, 2.67]
D. local maximum at (2.67, -3.48)
local minimum at (0, 6)
increasing on [0, 2.67]
decreasing on [-1, 0] and [2.67, 4]
Answer: C
You might also like to view...
Multiply.(5x6)

A. -  x7y3z3
B. -  x6y2z2
C. -  x6y3z3
D.  x7y2z2
Use the given bond table to find the requested value for Solar Energy bonds maturing in 2019. 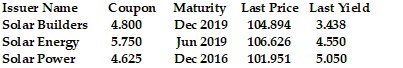 Coupon Rate
A. 57.50% B. 4.800% C. 4.625% D. 5.750%
Graph.16x2 - 9y2 + 128x - 54y + 31 = 0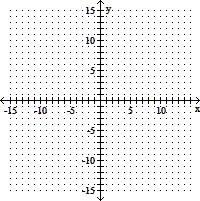
A. 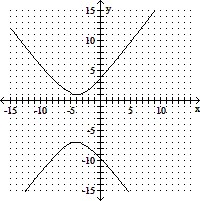
B. 
C. 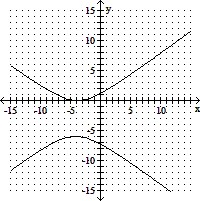
D. 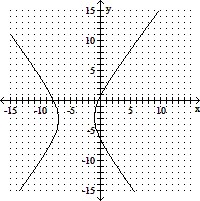
Solve the problem.If the average cost per unit C to produce x units of plywood is given by  what is the unit cost for 40 units?
A. -$12.50 B. $16.67 C. $37.50 D. $0.75