The following graph shows average fixed costs, average variable costs, average total costs, and marginal costs of production.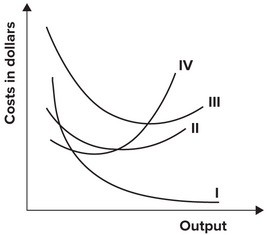 The average fixed cost curve is represented by which curve?
A. I
B. II
C. III
D. IV
Answer: A
You might also like to view...
In a recession, cyclical unemployment:
A. exceeds the natural rate of unemployment. B. is falling. C. is rising. D. equals the natural rate of unemployment.
If goods are completely unrelated, their cross price elasticity will
A) be greater than one. B) be less than one. C) be equal to zero. D) be negative.
When the tax rates imposed on the rich are high, a reduction in these rates
a. will always lead to a reduction in the tax revenue collected from the rich. b. will not affect the tax revenue collected from the rich. c. will increase the reported incomes of the rich and it may also lead to an increase in tax revenue collected from them. d. will decrease the reported incomes of the rich, and thereby reduce the tax revenue collected from them.
Suppose that the normal rate of return in the inkjet printer industry is 10% and the return being earned by firms in this industry equals exactly 5%. Which of the following is likely to follow from this scenario?
A. The normal rate of return will fall to 5% in the long run. B. Firms will want to leave the industry. C. New firms will want to enter the industry. D. Firms will collude to keep competition out.