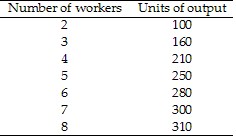
 Table 17.1Refer to Table 17.1. If the price of output is $2 per unit and we observe the firm hiring four workers, if the firm is maximizing profit, the wage rate must be between ________ and ________.
A. $40; $50
B. $50; $90
C. $80; $100
D. $320; $500
Answer: C
You might also like to view...
Which of the following goods is an example of a good that is nonexcludable but not nonrivalrous?
a. National defense. b. A fishing lake. c. A lighthouse. d. A radio broadcast.
Which of the following is true of the expenditure-based method of national accounting?
A) It does not track the purchase of goods and services by the government. B) It only tracks the purchase of goods and services by the government. C) It tracks the purchase of investment goods by firms and households. D) It does not track the purchase of services by households.
SUMMARY OUTPUTRegression StatisticsMultiple R0.971R-SquareAAdjusted R-SquareBStandard Error30.462Observations51ANOVA dfSSMSFSignificance FRegressionC747851.57373925.79402.989.89E-31Residual48D927.91 Total50792391.11 CoefficientsStandard Errort StatP-ValueLower 95%Upper 95%InterceptE62.1326.791.60E-301539.661789.51Price of Roses-6.68F-1.411.64E-01-16.162.81Disposable Income (M)9.730.34G1.23E-319.0410.42Determine the t-statistic of the estimated slope coefficient for disposable income (point G) and whether that estimated slope coefficient is statistically significant at the 5 percent level.
A. 0.03 and statistically insignificant since the t-statistic is less than 2 in absolute value. B. 3.31 and statistically significant since the t-statistic is greater than 2 in absolute value. C. 28.62 and statistically significant since the P-value is less than 5 percent. D. 3.31 and statistically insignificant since the P-value is less than 5 percent.
Price elasticity of demand is calculated as the ratio of the change in quantity demanded to the change in price.
Answer the following statement true (T) or false (F)