Refer to the diagrams. The solid lines are production possibilities curves; the dashed lines are trading possibilities curves. The data contained in the production possibilities curves are based on the assumption of:
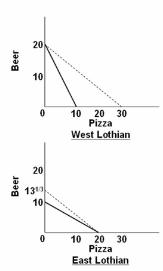
A. imperfect substitutability of resources between beer and pizza production.
B. constant costs.
C. decreasing costs.
D. increasing costs.
B. constant costs.
You might also like to view...
The above figure shows the U.S. market for replacement cell phone batteries. Area E is the
A) producer surplus when there is free trade. B) deadweight loss from tariff. C) tariff revenue. D) increase in producer surplus due to the tariff. E) gain in total surplus due to the tariff.
Which of the following would most likely increase the supply of college textbooks?
a. five major publishers go out of business b. paper costs double c. the wage rate of printers increases d. producers expect the price to rise in the future e. technology of book production improves
Which of the following properties is seen in a buy-sell transaction arranged by a pipeline?
a. Pipelines offer to resell gas to consumers even at a loss. b. Gas producers offer to sell gas to the pipelines at a discounted prices. c. Gas producers ration the amounts they supply to the pipelines. d. Pipelines evade the legal ceiling on their transportation charge by bundling the gas with transportation service.
Expansionary monetary policy:
A. increases the interest rate and increases the price level. B. decreases the interest rate and increases the price level. C. increases the interest rate and decreases the price level. D. decreases the interest rate and decreases the price level.