Use the following consumption schedule to answer the next question.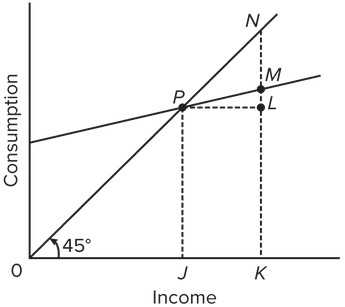 The graph above shows the relationship between consumption and income. The ratio LM/PL would be a measure of the
A. average propensity to consume.
B. marginal propensity to consume.
C. marginal propensity to save.
D. average propensity to save.
Answer: B
You might also like to view...
The actual income distribution might be more equal than current official figures suggest because current official figures ignore the return on human capital
Indicate whether the statement is true or false
A switch from a? pollution-tax policy to a? uniform-reduction policy will shift the supply curve of the polluting product upward and increase the equilibrium price.
A switch from a? pollution-tax policy to a? uniform-reduction policy will shift the supply curve of the polluting product
and
the equilibrium price.
How is it possible for the economy to have a recessionary gap?
A. Equilibrium is at a GDP level below full employment. B. Equilibrium is at a GDP level equal to full employment. C. Equilibrium is at a GDP level above full employment. D. GDP is rising at full employment. E. GDP is falling at full employment.
How is economic growth shown by the production possibilities curve?
A. by moving the curve to the left B. by changing the shape of the curve from a straight line to one that is bowed C. by moving up the existing curve D. by shifting the curve to the right