Figure 10-8
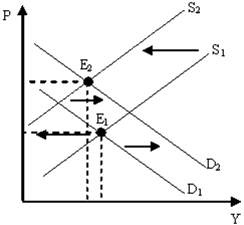
Figure 10-8 describes which of the following periods in the U.S.?
a.
1930s
b.
1973-1975
c.
late 1990s
d.
2007-2009
b
You might also like to view...
If new firms are expected to enter an existing market, ________
A) the market price is likely to fall B) the market demand is likely to increase C) the market supply is likely to fall D) the profits of all firms are likely to increase
If firms monopolistically competitive firms are making an economic profit, as new firms enter the market, each of the existing firms' demand curve shifts ________, the marginal curve shifts ________, and the profit-maximizing quantity ________
A) leftward; leftward; decreases B) rightward; leftward; increases C) leftward; rightward; decreases D) leftward; leftward; increases
Under the model of monopolistic competition, a(an) ________ in the number of firms in the industry will cause ________ to ________
A) increase; average price; decrease B) increase; average price; increase C) increase; average cost; decrease D) decrease; markup; decrease E) increase; marginal cost; decrease
Which of the following is true regarding opportunity cost?
a. Opportunity cost of engaging in some activity, such as attending opera, will be same for different people. b. Opportunity cost has nothing to do with scarcity and time. c. Opportunity cost may vary with circumstances. d. Opportunity cost of the chosen item is the value of all the alternatives that are foregone.