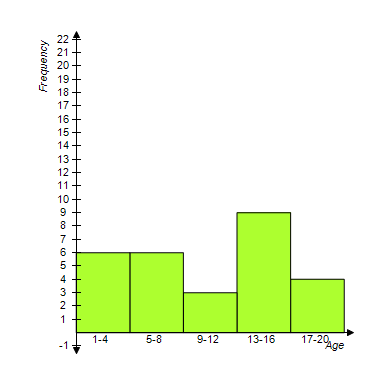
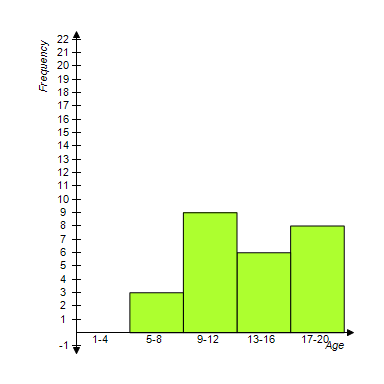
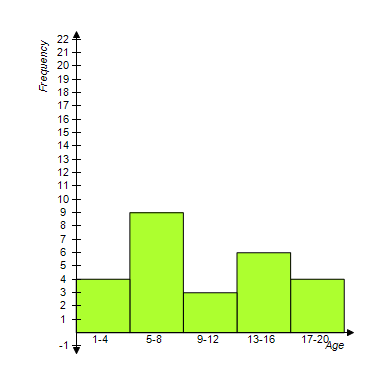
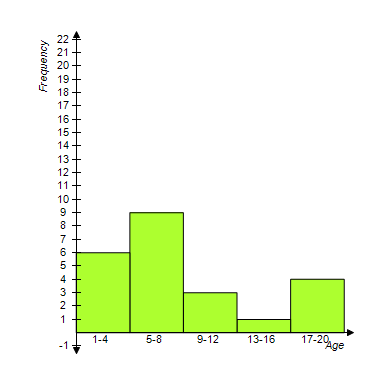
Which frequency histogram best describes the data given in the frequency table?
?
Age
Frequency
1-4
6
5-8
9
9-12
3
13-16
1
17-20
4
?
A. ?
B. ?
?
C. ?
??
D. ?
?
E. ?
?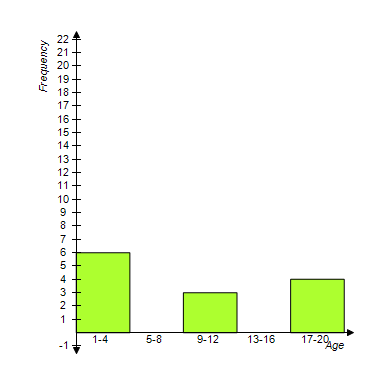
Answer: D
Mathematics
You might also like to view...
Find the area of the figure. Use 3.14 for ?.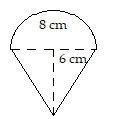
A. 49.12 cm2 B. 74.24 cm2 C. 73.12 cm2 D. Not enough data
Mathematics
Find an equation of the line that contains the given point and is parallel to the given line.-3x - y = 5, (-5, -8)
A. y = -3x - 23 B. y + 8 = mx + 5 C. y = -3x + 23 D. y + 8 = x + 5
Mathematics
Translate the percent problem to a proportion using x for the unknown value. Do not solve the proportion.2.2 is what percent of 19.7?
A.  =
= 
B.  =
= 
C.  =
= 
D.  =
= 
Mathematics
Does the graph represent a function that has an inverse function?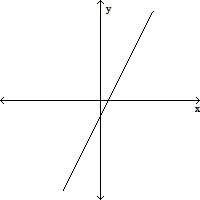
A. Yes B. No
Mathematics