Graph the inequality on a plane.x + y < -3
A. 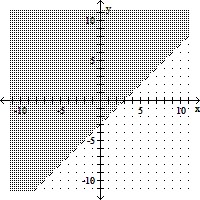
B. 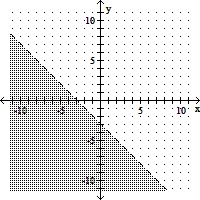
C. 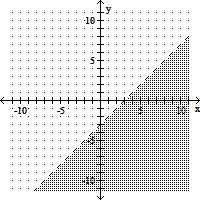
D. 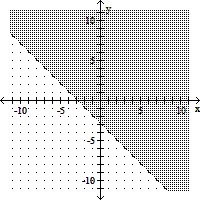
Answer: B
You might also like to view...
Solve the problem.Under a certain apportionment method State X receives 51 seats and State Y receives 19 seats. Ten years later, the population of State X has increased by 3%, while the population of State Y remains unchanged. Under the same apportionment method, State X now receives 50 seats and State Y receives 20 seats. This is called
A. the population paradox. B. the Alabama paradox. C. the new states paradox. D. a violation of the quota rule. E. none of these
Solve.Which hyperbola has larger eccentricity?I) II)
II)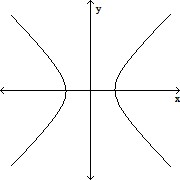
Fill in the blank(s) with the appropriate word(s).
Find the area or volume of the figure, as specified.Find the area. Use 3.14 for the value of ?.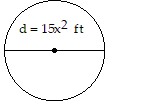
A. 94.2x4 ft2 B. 47.1x2 ft2 C. 176.625x4 ft2 D. 706.5x2 ft2
Find the exact value of the expression.sec-1(-2)
A. 
B. - 
C. - 
D. 