To examine the local housing market in a particular region, a sample of 120 homes sold during a year are collected. The data are given below:
Land Value ($)
Building Value ($)
Acres
Baths
Toilets
Fireplaces
Bedrooms
Age
Sale Price ($)
18,100
92,500
0.5
1
1
1
4
53.9
114,885
23,600
152,700
0.22
2
1
1
3
19.7
180,895
25,900
134,300
0.3
2
1
1
3
15.9
162,038
22,100
129,600
0.23
2
2
1
4
41
154,496
23,900
168,700
0.32
2
1
1
4
39.9
196,973
22,400
118,300
0.25
2
1
1
3
41.8
145,075
24,100
123,300
0.26
1
1
1
4
70.9
151,480
26,300
133,800
0.26
2
1
1
3
37.8
164,762
24,900
139,400
0.24
2
1
1
4
33
166,528
13,600
87,200
0.17
1
1
0
3
34.7
105,762
36,100
210,400
0.6
2
1
2
2
52.9
250,170
19,500
101,300
0.16
1
1
1
2
67.8
125,082
38,800
224,700
0.44
2
1
1
4
21.7
265,066
23,500
139,000
0.22
1
1
0
3
10.8
166,697
26,300
164,200
0.35
2
1
0
3
3.9
194,881
21,900
122,400
0.17
2
1
1
3
15.7
146,818
23,400
149,600
0.22
2
1
1
3
15.7
176,048
15,000
102,200
0.12
1
1
0
3
97.8
119,584
15,000
102,200
0.12
1
1
0
3
97.7
121,759
9,200
22,000
0.17
1
1
0
4
120.9
34,947
9,200
22,000
0.17
1
1
0
4
120.9
35,214
5,600
48,000
0.12
1
1
0
3
103.9
57,142
9,000
58,800
0.24
1
1
0
3
88
72,192
21,000
109,600
0.21
2
1
0
3
36.7
133,848
23,500
165,900
0.15
2
1
1
4
5.7
194,079
36,000
262,500
0.22
3
1
1
4
2.9
300,407
23,700
114,900
0.22
1
1
0
4
37.7
141,700
22,000
102,700
0.2
1
1
0
3
48.9
128,866
19,900
95,800
0.23
2
1
1
2
78.9
119,189
22,100
116,300
0.18
1
1
0
3
30.8
141,018
24,600
165,500
0.29
1
1
1
4
43
193,661
21,500
113,400
0.17
1
1
1
3
44.9
137,308
15,000
81,100
0.16
1
1
0
2
62.9
99,817
15,700
129,200
0.23
2
1
0
3
46.7
148,909
14,200
81,600
0.15
1
1
0
3
57.9
100,701
10,700
49,700
0.15
1
1
0
2
99.8
65,082
16,600
72,700
0.18
1
1
1
4
91.8
92,614
25,500
110700
0.21
1
1
1
3
48
137,889
15,100
74,300
0.23
1
1
1
3
71.8
91,180
7,400
55,500
0.15
1
1
0
2
96.8
64,119
28,500
129,400
0.25
1
1
0
4
49.9
160,139
25,100
83,900
0.2
1
1
0
3
45.8
113,043
50,100
164,600
0.23
2
1
0
3
44
217,684
83,300
276,000
0.61
3
1
1
2
47.9
360,936
124,500
552,300
1.05
4
1
2
4
5.7
679,795
47,000
214,400
0.22
2
1
2
4
92.9
264,115
64,600
185,000
0.58
2
1
1
4
91
254,075
33,900
138,800
0.22
1
1
1
4
97.9
173,987
41,100
156,300
0.18
1
1
1
3
76
200,251
29,100
96,400
0.28
1
1
0
1
57.8
130,214
56,400
256,400
0.4
1
1
1
3
56.8
316,874
45,400
219,200
0.21
1
1
1
3
79.8
267,672
23,800
92,100
0.15
1
1
1
4
91.9
119,769
52,800
172,800
0.27
2
1
2
2
74.8
229,499
25,100
99,200
0.19
1
1
0
3
36.7
128,456
27,200
152,600
0.18
2
1
1
3
16.7
181,102
28,100
102,900
0.18
1
1
1
3
75.8
132,977
28,800
98,800
0.19
1
2
0
3
53.9
131,411
33,400
103,900
0.45
2
1
1
4
84.9
139,697
20,700
95,600
0.14
1
1
1
3
89.8
120,046
25,600
101,900
0.2
1
1
0
2
57.8
131,026
25,800
110,700
0.18
1
1
0
3
51.9
141,202
29,300
147,700
0.2
1
1
1
4
90.9
181,575
26,000
116,000
0.18
1
1
1
3
44
144,513
25,900
73,500
0.16
1
1
0
2
81.8
100,953
32,800
125,000
0.35
1
1
1
3
68.7
160,546
31,100
166,800
0.2
1
1
2
2
57.7
199,970
25,800
105,300
0.17
1
1
0
3
58.8
134,647
27,200
94,800
0.17
1
1
0
3
42.9
124,311
25,000
105,900
0.16
1
1
1
3
82
133,543
29,200
117,500
0.2
1
1
1
3
53.8
151,392
30,000
93,300
0.26
1
1
0
2
55.7
124,476
20,400
112,000
0.13
2
1
1
3
80.9
136,599
23,600
83,400
0.16
1
1
0
2
57.7
110,399
16,200
85,800
0.1
1
1
1
2
67
105,027
29,300
123,900
0.22
1
1
1
4
44.8
157,819
27,000
97,800
0.18
1
1
0
3
46.8
129,675
25,600
86,300
0.16
1
1
0
3
61.7
115,952
46,200
220,500
0.57
2
1
1
4
50.8
268,552
22,900
160,000
0.15
3
1
1
3
20.7
187,870
27,100
105,200
0.21
1
1
0
3
51.8
135,549
30,700
107,100
0.3
1
1
0
3
70
142,738
29,100
102,400
0.23
2
1
0
2
58
135,284
34,700
150,400
0.28
1
1
2
3
68.9
189,790
20,000
80,400
0.24
1
1
0
3
66.9
105,302
35,700
159,400
0.28
2
1
1
4
1.7
196,936
35,100
161,500
0.25
2
1
1
3
8.8
201,349
33,700
162,500
0.21
2
1
1
4
8.8
198,580
33,700
162,500
0.21
2
1
1
4
8.8
200,228
36,400
176,100
0.29
2
1
1
4
8.9
215,634
33,200
122,300
0.2
2
1
0
3
4.9
157,208
39,200
169,200
0.36
2
1
1
3
5.9
212,662
33,100
180,100
0.2
2
1
1
4
5.8
217,543
16,000
98,400
0.19
1
1
0
4
49.9
118,491
24,900
63,800
0.45
2
1
1
2
83.9
91,539
22,000
121,300
0.27
1
2
0
4
34.9
147,802
20,000
107,600
0.23
1
1
1
3
36.7
131,948
33,900
230,800
0.27
2
1
1
3
10
268,444
22,100
153,800
0.3
1
1
1
3
46.8
180,464
22,800
111,100
0.23
1
1
0
3
52
137,326
24,700
117,800
0.32
1
1
0
3
48.7
145,115
38,700
118,700
0.81
1
1
1
3
47.8
159,644
25,800
108,000
0.26
2
1
0
2
53.3
135,049
31,700
140,500
0.34
1
1
1
3
40.6
174,475
82,200
171,700
1.23
2
1
1
3
56.4
257,467
19,500
147,600
0.53
2
1
1
2
28.2
169,311
24,400
132,000
0.25
2
1
1
3
14.2
157,570
22,500
119,800
0.18
2
1
1
3
15.5
143,676
25,900
117,100
0.29
2
1
0
3
17.7
146,960
22,700
95,000
0.25
1
1
0
3
55.6
121,175
21,200
56,700
0.23
1
1
0
2
96.6
81,869
34,000
163,800
0.26
2
1
1
4
15.2
199,361
18,900
118,000
0.17
1
1
0
3
45.5
139,981
33,900
151,600
0.26
2
1
1
3
25.3
186,637
23,800
133,500
0.21
2
1
1
3
13.6
161,123
23,900
119,000
0.21
2
1
1
3
14.3
146,054
18,500
110,500
0.19
2
1
2
4
32.2
130,575
36,300
122,500
0.61
1
1
2
3
56.2
162,270
47,300
298,800
0.36
3
1
1
4
31.4
348,138
36,600
238,700
0.28
2
1
2
3
25.5
278,839
Partition the data into training (50 percent), validation (30 percent), and test (20 percent) sets. Predict the sale price using a regression tree. Use Sale Price as the output variable and all the other variables as input variables. In Step 2 of XLMiner's Regression Tree procedure, be sure to Normalize input data, set the Maximum #splits for input variables to 59, set the Minimum #records in a terminal node to 1, and specify Using Best pruned tree as the scoring option. In Step 3 of XLMiner's Regression Tree procedure, set the maximum number of levels to 7. Generate the Full tree and Best pruned tree.
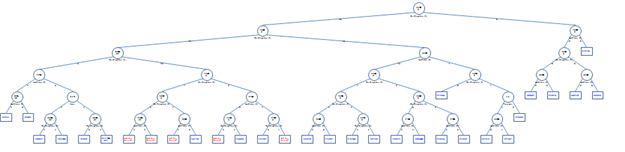
a. In terms of number of decision nodes, compare the size of the full tree to the size of the best pruned tree.b. What is the root mean squared error (RMSE) of the best pruned tree on the validation data and on the test data?c. What is the average error on the validation data and test data? What does this suggest?d. By examining the best pruned tree, what are the critical variables in predicting the sale price of a home?
What will be an ideal response?
a. There 59 decision nodes in the full tree and 41 decision nodes in the best pruned tree.
b. The RMSE on the validation set is $13,757.85, and the RMSE on the test data is $16,054.64.
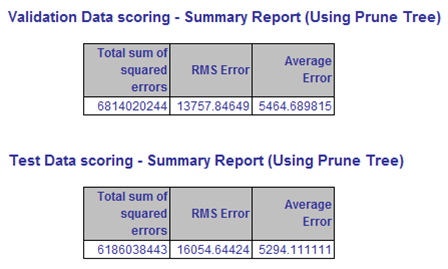
c. The average error on the validation set is $5,464.69, and the average error on the test data is $5,294.11. There is a slight evidence of systematic underestimation of home sale price.
?
d. The best pruned tree for the pre-crisis data contains decision nodes on BuildingValue, LandValue, Acres, Fireplaces, and Age.
You might also like to view...
The Real Estate Settlement Procedures Act (RESPA):
A. requires that title insurance be purchased from the company specified by the seller. B. requires that buyers receive advance disclosure of the settlement costs that will be incurred. C. is designed to prevent discrimination against pregnant women and families with children in settlement procedures. D. permits settlements for referral of business to title companies.
S calls B and says, "I will sell my 1966 Mustang convertible to you for $3,000." B knows that the car is worth $4,000 . B replies, "Would that include the trunk-mounted spare tire?" S hangs up without a word. B calls back in three days and says, "I'll buy the car for $3,000." Is there a contract? Discuss fully
MNE means mega nation experiments
Indicate whether the statement is true or false
In July, one of the processing departments at Junkin Corporation had beginning work in process inventory of $17,000 and ending work in process inventory of $19,000. During the month, $193,000 of costs were added to production and the cost of units transferred out from the department was $191,000. Required:Construct a cost reconciliation report for the department for the month of July.
What will be an ideal response?