Exhibit 3-3 Demand curves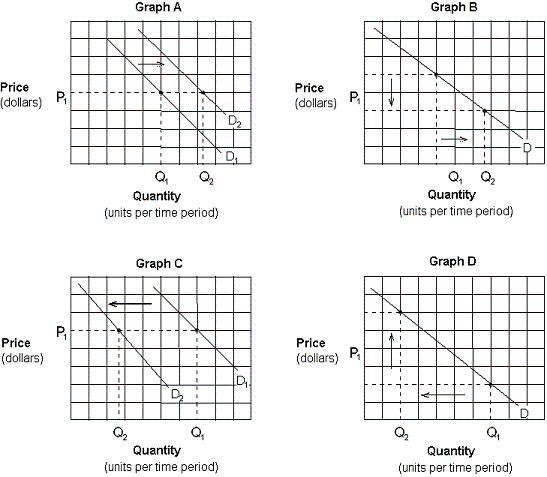
Assume that crackers and soup are complementary goods. Which of the graphs in Exhibit 3-3 depicts the effect of a promotional discount that decreases the price of crackers on the demand for soup?
A. Graph A.
B. Graph B.
C. Graph C.
D. Graph D.
Answer: A
You might also like to view...
On September 3, 2003, Universal Music Group announced plans to reduce the wholesale price of music CDs it distributes by an average of 25-30 percent. All else constant (i.e
, ignoring the effects of file-sharing programs), how would this change affect the retail market for new music CDs? A) Demand for CDs would increase, causing equilibrium price and quantity to increase. B) The supply of CDs would increase, causing equilibrium price to decrease and equilibrium quantity to increase. C) Demand for CDs would decrease, causing equilibrium price and quantity to decrease. D) The supply of CDs would decrease, causing equilibrium price to increase and equilibrium quantity to decrease.
If people expect nominal interest rates to be lower in the future, the expected return to bonds ________, and the demand for money ________
A) increases; increases B) increases; decreases C) decreases; increases D) decreases; decreases
There has been a massive relocation of heavy industry from the U.S. Northeast and upper Midwest to the "Sun Belt."
Indicate whether the statement is true or false
We don't typically see wages ________ in response to an economic downturn because ________.
A. fall; they are "sticky" and are slow to respond to shifts in the economy B. fall; they cannot fall below where they were previously set due to inflation C. rise; they cannot rise above the equilibrium in any circumstance D. rise; they are "sticky," and are slow to respond to shifts in the economy