In the graph showing the Phillips curve, at point B the inflation rate is ______.
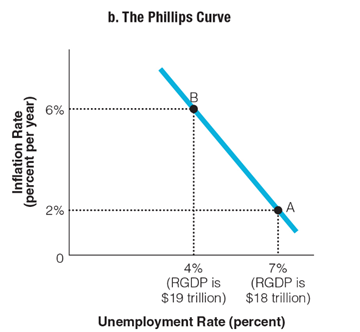
a. the same as at point A
b. less than at point A
c. more than at point A
d. double what it is at point A
c. more than at point A
You might also like to view...
On May 12, 2011, the U.S. dollar was worth 0.61 British pounds. How many dollars did it take to buy one British pound?
a. 1.19 b. 1.61 c. 1.64 d. 2.19
An internal financial analysis examines key financial ratios to determine the current state of the organization as well as trends.
a. true b. false
Which of the following statements best reflects the concept of present value?
A. "The savings bond I bought five years ago is now worth $1,000." B. "My $100 savings bond will be worth $200 in 10 years." C. "You owe me $500, due at the end of the year, but I will reduce your debt to $450 if you pay me now." D. "The $5,000 in my savings account is worth less today than five years ago because of inflation."
Between 1955 and 2006, Federal Spending as a percentage of GDP ranged between
A. 22% and 30%. B. 16% and 22%. C. 35% and 45%. D. 47% and 61%.