When analyzing the housing market, the supply curve
a. will be upward sloping because the higher the price of a house the more that will exist
b. will be horizontal to illustrate that the supply of housing is a stock variable
c. will be downward sloping; that is what went wrong with the housing market
d. will be vertical to illustrate that the supply of housing is a stock variable
e. could be horizontal, vertical or upward sloping depending upon the housing market in question
D
You might also like to view...
A flexible exchange rate system crisis involves
A) a revaluation of the currency. B) a rapid and uncontrolled depreciation of the currency. C) a decrease in the dollar value of the country's international debt. D) a sure political collapse of the ruling government. E) All of the above.
Demand and supply in the wheat market are given by:
QD = 2000 - 1000 P and QS = -500 + 1000 P where Q is millions of bushels and P is price per bushel. a. Find the equilibrium price and quantity. b. Suppose that the government wishes to support farm income and thus sets a price floor of $1.50/bushel. Find the size of the farm surplus. c. What is the cost of this program to the government?
Economic indicators, like unemployment claims and the average workweek, which change before real GDP changes, are called:
a. leading. b. lagging. c. coincident. d. structural.
Figure 17-8
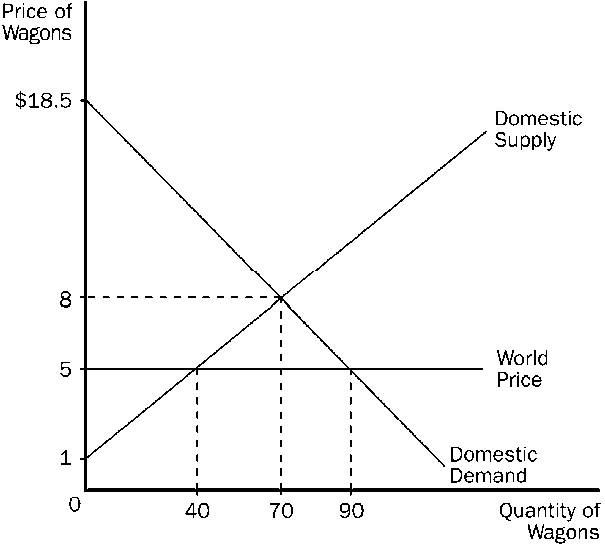
Refer to . The horizontal line at the world price of wagons represents the
a.
demand for wagons from the rest of the world.
b.
supply of wagons from the rest of the world.
c.
level of inefficiency in the domestic market caused by trade.
d.
surplus in the domestic wagon market.