Solve the problem.The graphs below represent the supply and demand for a product at various prices per unit. At what price does supply equal demand?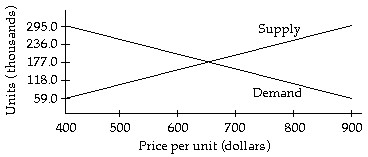
A. $650
B. $177
C. $400
D. $900
Answer: A
You might also like to view...
Find the exact value of the expression.cos  sin
sin  - cos
- cos  sin
sin 
A. 
B. 
C. 
D. 1
Estimate the indicated probability by using the normal distribution as an approximation to the binomial distribution.In one county, the conviction rate for DUI is 85%. Estimate the probability that of the next 100 DUI summonses issued, there will be at least 90 convictions.
A. 0.1038 B. 0.0420 C. 0.8962 D. 0.3962
Tell whether correlation is being used correctly. Identify any statistical errors.The correlation coefficient for the data shown in the scatter plot is close to -1 so the slope of the regression equation that goes through the points will be close to -1. 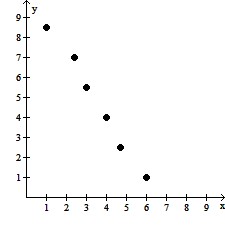
What will be an ideal response?
Use the square root property to solve the equation. 5x2 = 35
A. {17.5}
B. {± }
}
C. {8}
D. {±7}