Figure 10-9
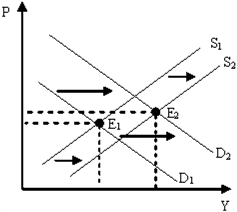
Figure 10-9 illustrates a period of
a.
economic growth and high inflation.
b.
economic growth and low inflation.
c.
economic recession and high inflation.
d.
economic recession and low inflation.
b
You might also like to view...
Which of the following is not a component of the index which measures economic freedom of a country?
a. Monetary freedom b. Cultural freedom c. Government size d. Freedom from corruption e. Labor freedom
Any factor that shifts the supply curve inward and to the left and does not affect the demand curve will raise the equilibrium price and reduce the equilibrium quantity
a. True b. False Indicate whether the statement is true or false
The self-correcting tendency of the economy means that rising inflation eventually eliminates:
A. unemployment. B. exogenous spending. C. recessionary gaps. D. expansionary gaps.
Use the following table, which shows the supply and demand schedules for the euro, to answer the next question.Quantity of Euros SuppliedPriceQuantity of Euros Demanded400$1.101003601.002003000.903002860.804002670.70500If European governments decide to fix the price of a euro at $0.80, they would have to ________.
A. sell 114 euros B. buy 114 euros C. sell 286 euros D. buy 286 euros