The figure below is a histogram showing the distribution of serum cholesterol level for a sample of men. Use the histogram to answer the following questions:
a. Is the percentage of men with cholesterol levels above 240 mg/dL closest to 30%, 50%, or 70%?
b. In which interval are there more men: 240-260 mg/dL or 280-340 mg/dL?
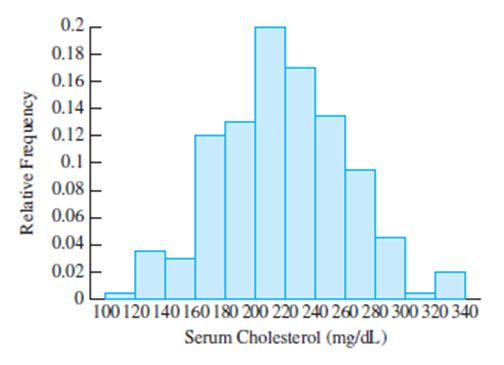
(a) The proportion is the sum of the relative frequencies (heights) of the rectangles above 240. This sum is approximately 0.14 + 0.10 + 0.05 + 0.01 + 0.02. This is closest to 30%.
(b) The height of the rectangle over the interval 240–260 is greater than the sum of the heights of the rectangles over the interval 280–340. Therefore there are more men in the interval 240–260 mg/dL.
You might also like to view...
How many OBD II warm-up cycles must occur for a stored DTC to be erased successfully?
What will be an ideal response?
In heavy-duty wall-form systems, the forms components are connected with _____.
a. screw clamps b. nuts and bolts c. form ties and walers d. quick-connect hardware
Subassemblies can have their own subassemblies.
Answer the following statement true (T) or false (F)
For each case shown below, derive the expression for the current through a 200 ?F capacitor. vC (t) is the voltage across the capacitor.