Analyze the graph of the given polar curve. Include the following information: If possible, describe the shape of the graph (circle, rose curve, limacon, etc.), and state the domain, range, and maximum r-value of the graph. State whether the graph is continuous and whether it is bounded. Describe any symmetry that the graph has. Give the equations of any asymptotes or state that the graph has no asymptotes.r = 7 - 2 cos ?
What will be an ideal response?
Convex limacon
Domain: all reals
Range: [5, 9]
Symmetric about the x-axis
Continuous
Bounded
Maximum r-value: 9
No asymptotes
You might also like to view...
Solve using a system of three linear equations.A deli sells three sizes of turkey sandwiches: the small turkey sandwich contains 6 ounces of meat and sells for $3.50; the regular turkey sandwich contains 9 ounces of meat and sells for $4.00; and the large turkey sandwich contains 13 ounces of meat and sells for $4.50. A customer requests a selection of each size for a reception. She and the manager agree on a combination of 50 sandwiches made from 27 pounds 4 ounces of turkey for a total cost of $196. How many of each size sandwich will be in this combination? (Note: 1 pound = 16 ounces)
A. 20 small sandwiches, 16 medium sandwiches, 14 large sandwiches. B. 18 small sandwiches, 22 medium sandwiches, 10 large sandwiches. C. 16 small sandwiches, 28 medium sandwiches, 6 large sandwiches. D. 14 small sandwiches, 18 medium sandwiches, 18 large sandwiches.
Provide an appropriate response.Suppose an annuity due consists of 6 yearly payments of $200 and the interest rate is 5% compounded annually. Determine (a) the present value and (b) the future value at the end of 6 years.
What will be an ideal response?
Solve the problem.A study was conducted to compare the average time spent in the lab each week versus course grade for computer students. The results are recorded in the table below. The linear model for this data is  where x is the number of hours spent in the lab and y is grade on the test. Use this model to predict the grade of a student who spends 12 hours in the lab. Number of hours spent in labGrade (percent)
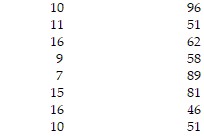
A. 68.7 B. 76.6 C. 66.3 D. 62.3
Use the payoff matrix to determine the best strategy.A computer manufacturer must decide whether or not to market a new product. The new product may or may not be better than the old product. If they market the new product and it is better than the old product, their sales should increase. If they market the new product and it is not better, they will lose money to competitors. If they do not market the new product, they will lose to competitors if it is actually better and will lose just the research costs if it is not better. The manufacturer estimates that the payoff matrix is as follows: New Product BetterNot Better src="https://sciemce.com/media/4/ppg__tttt0625191052__f1q52g2.jpg" style="vertical-align: -15.0px;" />What should the manufacturer do if he is a pessimist?
A. Market the new product
B. Do not market the new product
C. Wait and see what the competitors do
