Exhibit 10-4 Aggregate supply and demand curves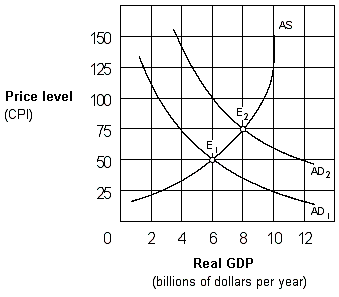
The increase in the price level as the economy moves from E1 to E2 in Exhibit 10-4 represents:
A. cost-push inflation.
B. demand-shock inflation.
C. wage push inflation.
D. demand-pull inflation.
Answer: D
You might also like to view...
Make the argument that sales taxes could be considered as a regressive tax
What will be an ideal response?
Which of the following business combinations likely exhibit economies of scope?
A) Banking services for individuals and banking services for other business B) Retail clothing stores and electronic (internet) clothing sales C) Hospitals that perform heart surgery and hospitals that perform cosmetic surgery D) all of the above
The physical or perceived differences between goods in a market that makes them close, but not perfect, substitutes are called
a. complementary goods b. substitute goods c. natural differentiation d. oligopolistic differentiation e. product differentiation
According to Kathryn Edin and Laura Lein, virtually all poor single mothers supplemented their income with money from _______________________.
Fill in the blank(s) with the appropriate word(s).