Solve the problem.Suppose that the speed of a car, measured in miles per hour (mph), is monitored for some short period of time after the driver applies the brakes. The following table relates the speed of the car to the amount of time, measured in seconds (sec), elapsed from the moment that the brakes are applied. Make a scatter diagram of the data. What is happening to the speed of the car during this time frame?
A. The speed of the car
increased as time elapsed.
B. The speed of the car
decreased as time elapsed.
C. The speed of the car
increased as time elapsed.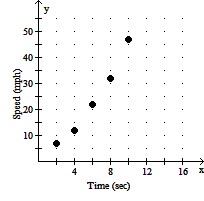
D. The speed of the car
decreased as time elapsed.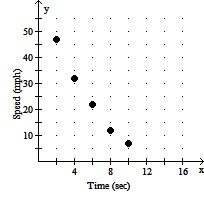
Answer: D
You might also like to view...
Solve the problem.Suppose that the dollar cost of producing x radios is 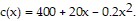 Find the average cost per radio of producing the first 30 radios.
A. $27.33 B. $420.00 C. $770.00 D. $820.00
The number of sales calls made by certain employees during a special time span are given. 141, 137, 136, 135, 134, 132, 131, 130, 130, 130, 126, 125, 125, 124, 124, 122, 122, 121, 121, 119.Find the quartiles for the set of sales calls.
A. 133, 128, 123 B. 141, 130, 119 C. 141, 128.25, 119 D. 133, 130, 123
Factor completely. Make sure you factor out the GCF first if possible. If prime, so state.3x3 - 3x2 - 36x
A. (x - 3)(3x2 + 12) B. 3x(x + 3)(x - 4) C. 3x(x - 3)(x + 4) D. (3x2 + 9x)(x - 4)
Add or subtract as indicated. Write the answer in simplest form. +
+ 
A. 
B. 
C. 
D. 