The graph in Figure 9-2 represents the:a
electromagnetic spectrum.
b. action spectrum of photosynthesis.
c. absorption spectra for chlorophylls a and b.
d. process of cyclic electron transport.
e. process of noncyclic electron transport.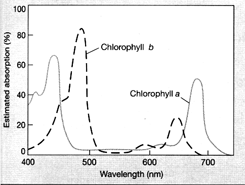
C
You might also like to view...
Genes that are situated close on a chromosome
A) do not affect one another. B) do not cross over. C) do not assort independently. D) produces Mendelian ratios for crosses tracking two or more genes.
When fungal buds remain attached in a row following cell division, the resulting chains of yeast cells are called ________.
A. septa B. dimorphic C. pseudohyphae D. mycelia E. molds
Why is fossil record biased and incomplete?
What will be an ideal response?
The higher the phenol coefficient value, the ________ effective the disinfectant under the test conditions.
A. more B. less