Suppose that the average adult in the United States will work x number of days (rounded to the nearest day) to earn enough to pay for all of the household's leisure activities in that year. This number can be calculated by multiplying the average percent of household income spent on leisure activities by 365 (the number of days in a year). The bar graph shows the percent of income spent in various countries of the world. Use the graph to answer the question.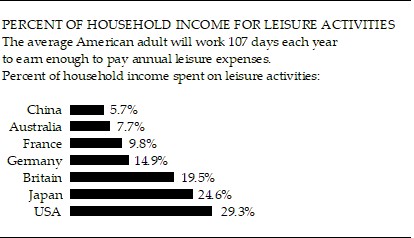 List all countries in the graph in which less than 12% of household income is spent, on average, for leisure activities.
A. China, Australia, France, Germany
B. China, Australia, France
C. Germany, Britain, Japan, USA
D. China, Australia
Answer: B
You might also like to view...
Find the triple scalar product (u x v) ? w of the given vectors.u = 4i + 2j - k; v = 5i + 6j - 2k; w = 9i + 10j - 9k
A. -11 B. -274 C. -78 D. -186
Which of the following is a dynamic statistics software package that produces non-conventional data displays?
a. Geometer's Sketchpad b. TinkerPlots c. SPSS d. Fathom
Solve the problem.Andrew's gross income each week is $350. Andrew has $14 deducted for health insurance. What percent of his gross income is deducted for health insurance?
A. 14% B. 6% C. 4% D. 3%
Solve the problem.Use the trigonometric identity tan 2x =  to find Dxtan 2x.
A. 2 sec2x(1 - tan2x) B. 2 sec2x(1 + tan2x) C. 2 sec2x tan2x D. 2 tan2x + tan3x