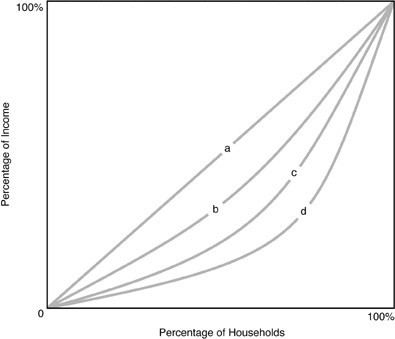
 In the above figure, the curve that represents the most income inequality is
A. a.
B. b.
C. c.
D. d.
Answer: D
You might also like to view...
Consider a good whose own price elasticity of demand is -0.5 and price elasticity of supply is 1.5. The fraction of a specific tax that will be passed through to consumers is ________
A) 0 B) 0.25 C) 0.5 D) 0.75 E) 1
An increase in the U.S. demand for foreign exchange will cause a(n)
a. increase in the price of foreign exchange, which is a depreciation of the U.S. dollar, making foreign goods cheaper to U.S. residents b. increase in the price of foreign exchange, which is a depreciation of the U.S. dollar, making foreign goods more expensive to U.S. residents c. decrease in the price of the U.S. dollar, which is an appreciation of the U.S. dollar d. increase in the price of foreign exchange, which is an appreciation of the U.S. dollar e. decrease in the price of foreign exchange, which is an appreciation of the U.S. dollar
A major drawback associated with the assessment of income distribution is that they neglect the effects of taxes and in-kind transfers
Indicate whether the statement is true or false
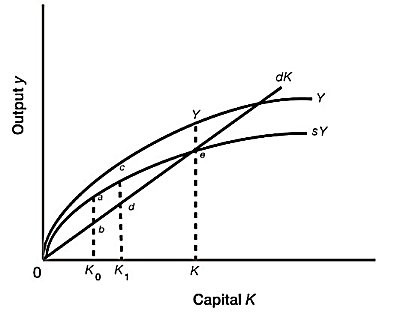
 Refer to Figure 13A.1. Capital deepening occurs as long as:
A. total saving exceeds depreciation. B. depreciation exceeds total saving. C. total saving and depreciation are equal. D. the level of Y is increasing.