Graph the function f(x) over the given interval. Partition the interval into 4 subintervals of equal length. Then add to your sketch the rectangles associated with the Riemann sum  , using the indicated point in the kth subinterval for ck.f(x) = -3x2, [0, 4], left-hand endpoint
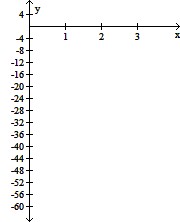
A. 
B. 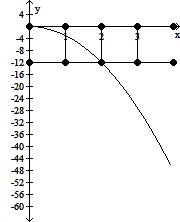
C. 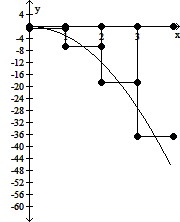
D. 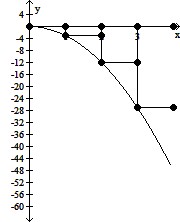
Answer: D
Mathematics
You might also like to view...
Provide an appropriate response.True or false? The equation -x2 = - 121 has no real solutions. If false, give the solution or solutions.
A. True B. False; 11 and -11 C. False; 11 D. False; -11
Mathematics
Find the LCD for the given fractions. ,
,  , and
, and 
A. 30 B. 12 C. 60 D. 20
Mathematics
Graph the given equation with the scatterplot of the data displayed in the table. Use ZoomStat to ensure all points appear on the screen.y = 1.5x + 2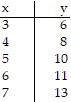
A. 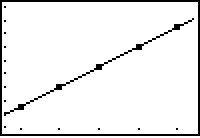
B. 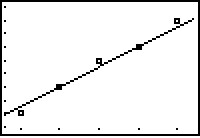
C. 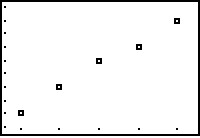
D. 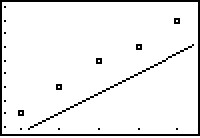
Mathematics
Graph the parabola described.Vertex at (0, 0); Focus at (-3, 0)
A. 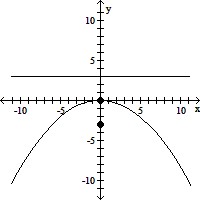
B. 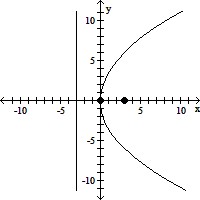
C. 
D. 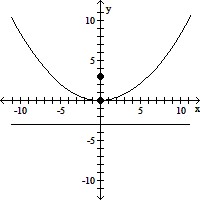
Mathematics