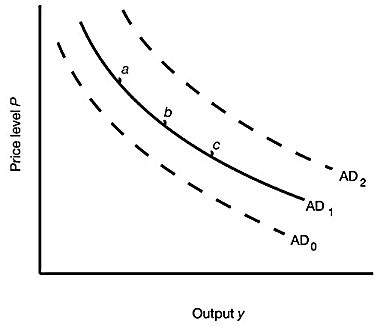
 Figure 14.1 shows three aggregate demand curves. A movement from point b to point c could be caused by a(n):
A. increase in the money supply.
B. decrease in taxes.
C. decrease in the price level.
D. decrease in government spending.
Answer: C
You might also like to view...
Use the following table to answer the question below. Giovanni's Production Possibilities ScheduleRuby's Production Possibilities SchedulePounds of Green BeansPounds of CornPounds of Green BeansPounds of Corn0160032040120102408080201601204030801600400The terms of trade for 1 pound of green beans must lie between ________ and ________ pounds of corn.
A. 1, 8 B. 1, 4 C. 1/8, 1 D. 1/8, 2
In the above table, the marginal product of the 7th worker is 6. What is the total product when 7 workers are employed?
A) 68 B) 70 C) 72 D) 76
According to the graph shown, total surplus is area:
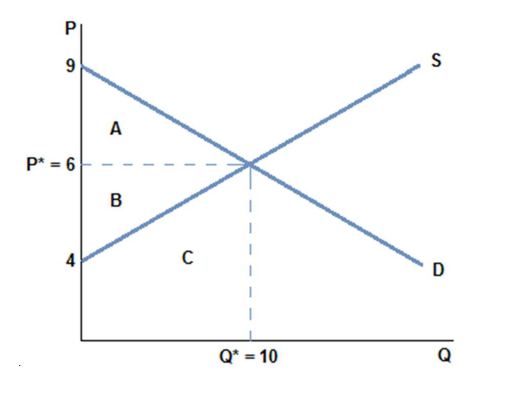
A. A + B + C.
B. B.
C. A.
D. A + B.
When the home construction industry does poorly due to a recession, this is an example of:
A. risk premium. B. unique risk. C. idiosyncratic risk. D. systematic risk.