 In the above figure, at the equilibrium level of real GDP, there is
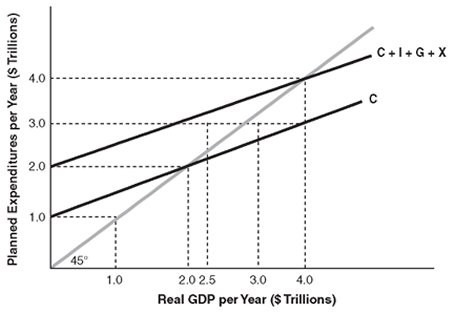
A. a negative tax rate.
B. zero saving.
C. negative saving.
D. positive saving.
Answer: D
You might also like to view...
Both firm A and firm B emit 300 tons of pollution. Suppose both firm A and firm B have permits that allow each to emit 100 tons of pollution
If it costs $5,000 for firm A to eliminate 100 tons of pollution and it costs firm B $6,000 to eliminate 100 tons of pollution, then A) firm B will sell its permits to firm A for a price above $6,000. B) firm A will sell its permits to firm B for a price below $6,000. C) firm A will sell its permits to firm B for a price above $6,000. D) firm B will sell its permits to firm A for a price below $6,000.
Consider two countries, Alpha and Beta. In Alpha, real GDP per capita is $6,000. In Beta, real GDP per capita is $9,000
Based on the economic growth model, what would you predict about the growth rates in real GDP per capita across these two countries? A) The growth rate of real GDP per capita in Alpha and Beta will be the same. B) The economic growth model makes no predictions regarding differences in growth rates of real GDP per capita across the two countries. C) The growth rate of real GDP per capita will be lower in Alpha than it is in Beta. D) The growth rate of real GDP per capita will be higher in Alpha than it is in Beta.
If the required reserve ratio is 10 percent, currency in circulation is $400 billion, checkable deposits are $1000 billion, and excess reserves total $1 billion, then the money supply is ________ billion
A) $10,000 B) $4000 C) $1400 D) $10,400
Monetary policy has one clear advantage over fiscal policy by virtue of its very short
A) data lag. B) data and recognition lags. C) legislative and transmissions lags. D) effectiveness lag.