The graph shown portrays a subsidy to buyers. The deadweight loss arising from the subsidy is:
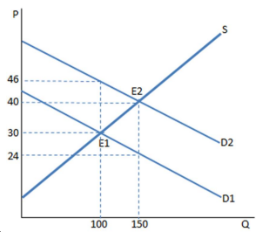
A. $400.
B. $3,600.
C. $750.
D. $800.
A. $400.
You might also like to view...
Arthur is an unskilled worker who is currently unemployed. He has been offered a job that pays $40 a day, but he is currently receiving unemployment insurance benefits equal to $50 a day, so he chooses not to accept the job and to continue looking for a better job. Arthur is ________ unemployed.
A. cyclically B. structurally C. not D. frictionally
The spending multiplier effect is the result of a movement along the aggregate expenditures (AE) line
a. True b. False Indicate whether the statement is true or false
The price elasticity of demand for tickets to local hockey matches is estimated to be equal to 0.89 . In order to boost ticket revenues, an economist would advise:
a. decreasing the price of hockey match tickets because demand is elastic b. increasing the price of hockey match tickets because demand is elastic. c. not changing the price of hockey match tickets because demand is unit elastic. d. increasing the price of hockey match tickets because demand is inelastic.
Suppose you are viewing a graph of the total revenue generated from the sale of bananas. On the horizontal axis the numbers indicate the quantity of bananas. On the vertical axis the numbers indicate total revenue. Suppose there are two lines on the graph, A and B, and they only meet when quantity is zero. If, at an output of 10,000 bananas, A lies above B, we can say that
a. A corresponds to more bananas than B b. A represents average revenue at a lower price than B c. A represents marginal revenue at a higher price than B d. A represents total revenue at a higher price than B e. A represents total revenue at a lower price than B