Refer to the information provided in Figure 3.10 below to answer the following question(s).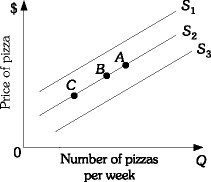 Figure 3.10Refer to Figure 3.10. A decrease in quantity supplied is represented by a movement from
A. Point B to Point A along supply curve S2.
B. S2 to S3.
C. Point B to Point C along supply curve S2.
D. S2 to S1.
Answer: C
You might also like to view...
Which of the following conditions must be TRUE so that a firm can profitably price discriminate?
A) The firm must be able to identify individual or groups of consumers with different demand curves. B) The firm must be able to identify how its consumers' demand curves differ. C) The good cannot be easily resold. D) All of the above.
Historical note concerning U.S. price levels: During the 1970s, with the onslaught of OPEC oil price increases
a. inflation occurred and it was primarily cost-push b. inflation was approximately zero because the Vietnam war ended and the demand for military goods fell dramatically c. deflation was persistent d. inflation occurred and it was primarily demand-pull e. stagflation, the difference between inflation and deflation, was approximately zero
In the prisoner's dilemma game:
A. a stable outcome is impossible. B. a cooperative strategy can lead to a more beneficial outcome for both players. C. neither player has a dominant strategy. D. a noncooperative strategy will lead to a positive-positive outcome.
The Norwegian economy can be characterized by Equation 24.3.EQUATION 24.3:C = 100 + 0.8Yd G = 500T = 200I = 200Refer to Equation 24.3. At the equilibrium level of output in Norway, saving equals
A. 1,660. B. 850. C. 630. D. 500.