Solve the problem.The following chart shows the number of injuries in Babyland caused by drinking from aluminum cans for children 3 and under for the years 1995-2000.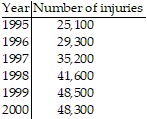 Use the data from 1995 and 2000 to find a linear function that can be used to estimate the number of aluminum can injuries I, x years after 1995. Use your function to predict those years for which the number of aluminum can injuries will exceed 80,000.
A. I(x) = 4640x + 25,100; Years after 2006
B. I(x) = 4540x + 25,600; Years after 2007
C. I(x) = 4640x + 25,100; Years after 2005
D. I(x) = 4540x + 25,600; Years after 2008
Answer: A
Mathematics
You might also like to view...
Add the given pair of complex numbers geometrically.z1 = 4 + 12i, z2 = -3i
A. 4 + 15i B. 4 + 36i C. 4 - 36i D. 4 + 9i
Mathematics
Add or subtract. +
+ 
A. 
B. 
C. 
D. 
Mathematics
Use the equation and the corresponding graph for the quadratic function to find what is requested.f(x) = (x - 1)2 - 3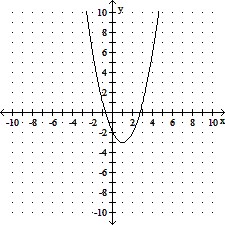 Find the coordinates of the vertex.
A. (1, -3) B. (-1, 3) C. (1, 0) D. (-1, -3)
Mathematics
Insert the symbol <, >, or = to form a true statement.0.087  0.87
0.87
A. 0.087 > 0.87 B. 0.087 = 0.87 C. 0.087 < 0.87
Mathematics