Using Figure 1 above, if the aggregate demand curve shifts from AD2 to AD1 the result in the long run would be: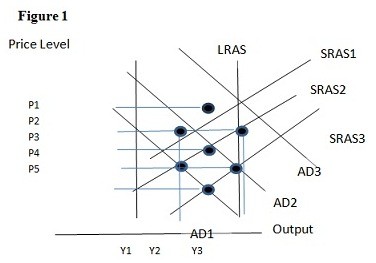
A. P4 and Y1.
B. P4 and Y2.
C. P5 and Y1.
D. P5 and Y2.
Answer: D
You might also like to view...
The above figure shows Jane's budget line and two of her indifference curves. When Jane is consuming at her best affordable point, what is her marginal rate of substitution?
A) 2.0 lobster dinners per steak dinner B) 1.0 lobster dinners per steak dinner C) 0.5 lobster dinners per steak dinner D) 0.33 lobster dinners per steak dinner
One source of structural unemployment is ________
A) the seasonal character of production in some industries, e.g. agriculture in Alaska during winter months B) falling sales in an economic downturn C) wage rigidity D) high search costs
Budget surpluses can stimulate capital formation and spur economic growth.
Answer the following statement true (T) or false (F)
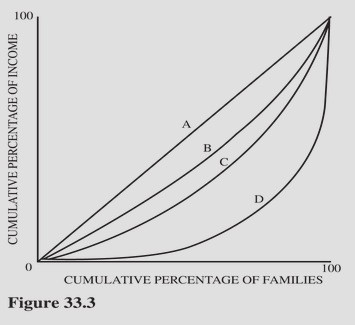 Figure 33.3 illustrates Lorenz curves for four different economies. For which economy would the lowest 20 percent of families receive the smallest share of total income?
A. A. B. B. C. C. D. D.