Refer to the information provided in Figure 2.5 below to answer the question(s) that follow.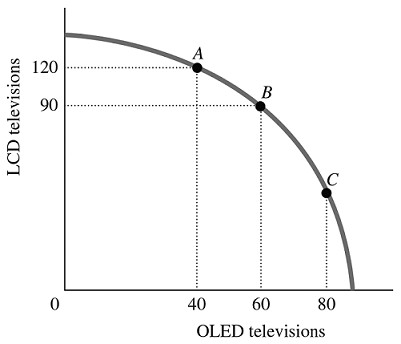 Figure 2.5Refer to Figure 2.5. For this economy to move from Point A to Point B, ________ additional OLED TVs could be produced when the production of LCD TVs is reduced by 30.
A. exactly 20
B. more than 20
C. fewer than 20
D. exactly 90
Answer: A
You might also like to view...
Suppose the growth rate of GDP in the United States is 4.2 percent. If 2.9 percent and 1.3 percent of GDP growth are due, respectively, to capital and labor growth, the amount resulting from technological progress is
A) 0 percent. B) 1.3 percent. C) 2.9 percent. D) 4.2 percent.
Average fixed costs of production
A) will rise at a fixed rate as more is produced. B) remain constant. C) graph as a U-shaped curve. D) fall as long as output is increased.
Which of the following is NOT an example of a way in which microeconomic analysis can help in designing environmental policy?
A) Determining the optimal level of vehicle fuel efficiency standards B) Designing laws to provide incentives for firms to implement clean technologies in new vehicles C) Lobbying consumers and firms to reduce consumption of energy D) Examining the tradeoffs between ecological benefits of environmental legislation and its impacts on consumers' standard of living
The major flaw of the linear probability model is that
A) the actuals can only be 0 and 1, but the predicted are almost always different from that. B) the regression R2 cannot be used as a measure of fit. C) people do not always make clear-cut decisions. D) the predicted values can lie above 1 and below 0.