Use the pictograph to answer the question.For selected countries, this pictograph shows approximately how many kilograms of seafood are consumed by each person (per capita) annually.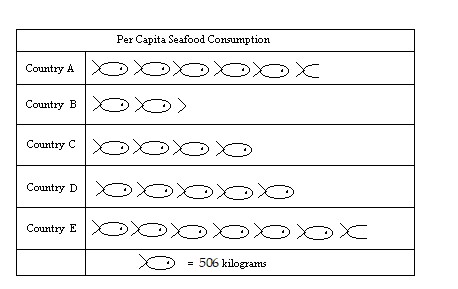 People in Country D eat approximately what percent more seafood than people in Country C?
A. 50%
B. 25%
C. 125%
D. 75%
Answer: B
Mathematics
You might also like to view...
Some units of time are _______, minutes, hours, and days.
A. seconds B. foot C. meter D. cup
Mathematics
Solve the system by elimination.5 x - y = 242x + y = 11
A. No solution B. (5, 1) C. (1, 5) D. (5, 2)
Mathematics
Provide an appropriate response.Under what conditions must the inequality symbol be reversed when solving an inequality?
What will be an ideal response?
Mathematics
Find fraction notation and simplify.47 %
%
A. 
B. 
C. 
D. 
Mathematics