A visual expression of income distribution is depicted by
a. the Gini coefficient
b. the IRS curve for incomes held by households
c. supply and demand curves for the four resources: labor, capital, land, and entrepreneurship
d. the Lorenz curve
e. the diagonal on a Gini distribution
D
You might also like to view...
Refer to the figure below. In response to gradually falling inflation, this economy will eventually move from its short-run equilibrium to its long-run equilibrium. Graphically, this would be seen as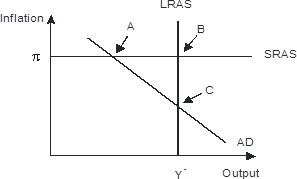
A. long-run aggregate supply shifting leftward B. Short-run aggregate supply shifting downward C. Aggregate demand shifting rightward D. Aggregate demand shifting leftward
Which of the following is most consistent with the time-inconsistency problem?
A) while it is ten o'clock in the morning in Chicago, it will be eleven o'clock in New York City B) a monetary policy action that is implemented in January will not begin to influence economic variables for several months C) a parent who acquiesces to a child's demand just to keep them quiet in a public setting D) an economic model with adaptive expectations
How would the impact on the exchange rate differ if the Fed were to sell U.S. Treasury securities instead of selling an equal amount (in $ terms) of euros?
What will be an ideal response?
Potential GDP is an estimate of the economy’s ability to produce goods and services if the
A. labor force is fully employed. B. price level is stable. C. trade balance is zero. D. federal budget is balanced.