Refer to the graph. Which of the lines in the diagram represent(s) a progressive tax?
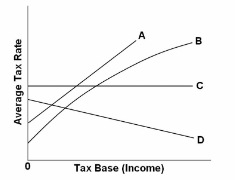
A. Both A and B.
B. D only.
C. C only.
D. B only.
A. Both A and B.
You might also like to view...
A recession is a period of time in which the total output of the economy rises.
Answer the following statement true (T) or false (F)
The observation that countries with high rates of population growth don't have higher per capita income ________
A) suggests that the Solow model is unrealistic B) implies that technology doesn't work as well in countries where the population is growing rapidly C) is not supported by most empirical studies D) is consistent with the Romer model as applied to the world as a whole
The greater the elasticities of supply and demand, the smaller are the gains from trade
a. True b. False Indicate whether the statement is true or false
If technological developments increase the marginal product of labor, then the:
A. demand for labor will decrease. B. demand for labor will increase. C. supply of labor will increase. D. the equilibrium wage rate will decrease.