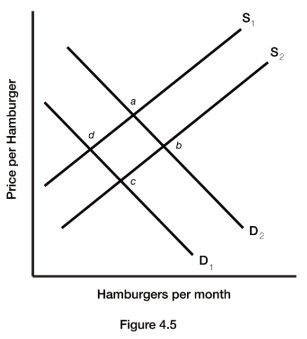
 Figure 4.5 illustrates a set of supply and demand curves for hamburgers. A decrease in supply and a decrease in demand are represented by a movement from:
A. point c to point a.
B. point b to point d.
C. point d to point a.
D. point a to point b.
Answer: B
You might also like to view...
If MPS is equal to 0.15 and MPI is equal to 0.10, an initial change of $19,000 in government expenditure would result in a total change of _____ in income
a. $19,000 b. $16,150 c. $20,000 d. $76,000 e. $126,667
Which of the following will most likely occur in the short run if long-run equilibrium is disturbed by an unanticipated decrease in aggregate demand?
a. a decrease in output and a higher price level b. an increase in output and a higher price level c. a decrease in output and a lower price level d. an increase in output, while prices remain unchanged
As used in the text, the "composite good" refers to:
a. large purchases that cannot be incrementally divided b. an abstraction requiring more than a three-dimensional graph c. income not spent on good X is two-dimensional graphical presentation d. the notion that consumers cannot be modeled graphically e. none of the above
Why is the monopolistic competitor’s demand curve more elastic than a pure monopolist’s, but less elastic than a pure competitor’s? What factors determine the price elasticity of demand for a monopolistic competitor?
What will be an ideal response?