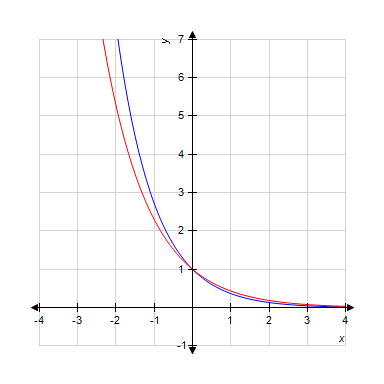
Given the graph of the functions  and
and  . Determine the color of the graph that corresponds to
align="middle" style="vertical-align: middle;" data-wiris-created="true" varid="variable_id_field" variablename="impvar_83176940760a4e73b290ea6f6" />.
?
?
Select the correct answer.
?
A. Blue
B. Red
Answer: B
You might also like to view...
At one high school, students can run the 100-yard dash in a mean of 15.2 seconds with a standard deviation of 0.9 seconds. The times are very closely approximated by a normal curve. Rounding to the nearest tenth of a percent as necessary, find the percent of times that are:Less than 15.2 seconds
A. 16% B. 68% C. 50% D. 34%
Solve the problem.Michael decides to walk to the mall to do some errands. He leaves home, walks 5 blocks in 16 minutes at a constant speed, and realizes that he forgot his wallet at home. So Michael runs back in 12 minutes. At home, it takes him 3 minutes to find his wallet and close the door. Michael walks 3 blocks in 12 minutes and then decides to jog to the mall. It takes him 10 minutes to get to the mall which is 4 blocks away. Draw a graph of Michael's distance from home (in blocks) as a function of time. 
What will be an ideal response?
Set up an equation that can be used to solve the problem. Solve the equation and answer the question asked. A car rental agency charges $175 per week plus $0.25 per mile to rent a car. How many miles can you travel in one week for 
A. 262.5 miles B. 1400 miles C. 675 miles D. 700 miles
Solve the equation.y2 - 5y = 2
A.  ,
, 
B.  ,
, 
C. ?
D.  ,
, 