In the bar graphs below, a projection of population by age groups and gender for two different countries is given as a percent of the country's population at the time. Provide an appropriate response.Population Pyramids for Countries A and B: 2006 and 2050

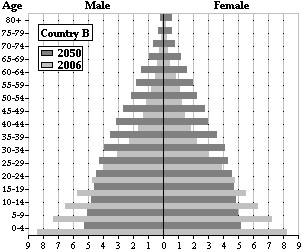 In the 2050 projection, which country has the largest portion of its population in the 80+ age group, and what was that percent?
A. Country A with about 6.5%
B. Country B with about 1%
C. Country A with about 4%
D. Country A with about 10.5%
Answer: D
Mathematics
You might also like to view...
Find the specified minor and cofactor for the matrix A.M22 and A22 if A = 
A. M22 = -82 and A22 = -82 B. M22 = 82 and A22 = -82 C. M22 = -77 and A22 = 77 D. M22 = -77 and A22 = -77
Mathematics
Insert <, >, or = to make the statement true.-94  -62
-62
A. = B. > C. <
Mathematics
Solve the problem.If h(x) =  2, find all values of x for which h(x) =
  .
.
A. -6, 5 B. -10, 12 C. -12, 10 D. -5, 6
Mathematics
Use point plotting to graph the plane curve described by the given parametric equations.x = 3t, y = t + 4; -2 ? t ? 3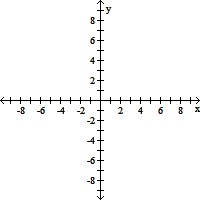
A. 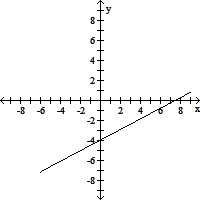
B. 
C. 
D. 
Mathematics