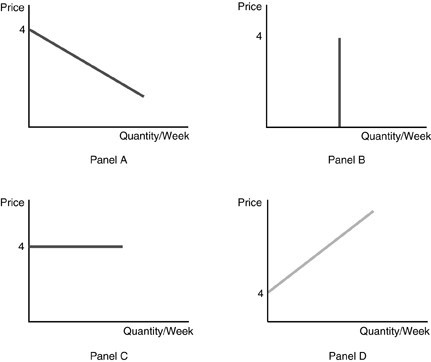
 Refer to the above figure. Which of the graphs represent the demand curve for a perfectly competitive industry?
A. Panel A
B. Panel B
C. Panel C
D. Panel D
Answer: A
You might also like to view...
If Brian, age 24, had no job but was available for work and had looked for a job the week before the survey, Brian is classified in the Current Population Survey as
A) unemployed. B) a discouraged worker. C) not in the labor force. D) employed. E) not in the working-age population.
If the Federal Reserve raises the U.S. interest rate, foreigners'
A) demand for U.S. dollars will increase and the exchange rate will rise. B) demand for U.S. dollars will decrease and the exchange rate will fall. C) demand for U.S. dollars will increase and the exchange rate will fall. D) demand for U.S. dollars will decrease and the exchange rate will rise.
GDP does not count:
a. the estimated value of homemaker production. b. state and local government purchases. c. spending for new homes. d. changes in inventories.
In 2018, Janice Quinn sells a five-year-old car to Used Car, Inc. for $4,000. In the same year, Used Car, Inc. resells the car to Hilda Goner for $4,750. What is the contribution of these transactions to GDP in the year 2015?
A. $750 B. $0 C. $8,750 D. $4,000