The table shows, for some particular year, a listing of several income levels and, for each level, the proportion of the population in the level and the probability that a person in that level bought a new car during the year. Given that one of the people who bought a new car during that year is randomly selected, find the probability that that person was in the indicated income category. Round your answer to the nearest hundredth. 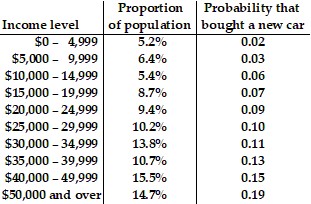 $50,000 and over
A. 0.22
B. 0.25
C. 0.28
D. 0.24
Answer: B
Mathematics
You might also like to view...
Solve the problem. Use 3.14 for ?, if necessary.The face-off areas in ice hockey have a diameter of 31.1 ft. Find the area of a face-off circle. Round to the nearest tenth, if necessary.
A. 3037.0 sq ft B. 759.3 sq ft C. 379.6 sq ft D. 97.7 sq ft
Mathematics
Find the distance between the pair of points on the number line. ,
, 
A. 
B. 
C. 
D. 
Mathematics
Use mathematical induction to prove the following.0.11n < 0.11n-1
What will be an ideal response?
Mathematics
A typical Social Security number is 555-47-5593. How many Social Security numbers are possible if the first three digits cannot be 1?
Fill in the blank(s) with the appropriate word(s).
Mathematics