According to the graph shown, if this economy were to open to trade, the amount consumed domestically would:
This graph demonstrates the domestic demand and supply for a good, as well as the world price for that good.
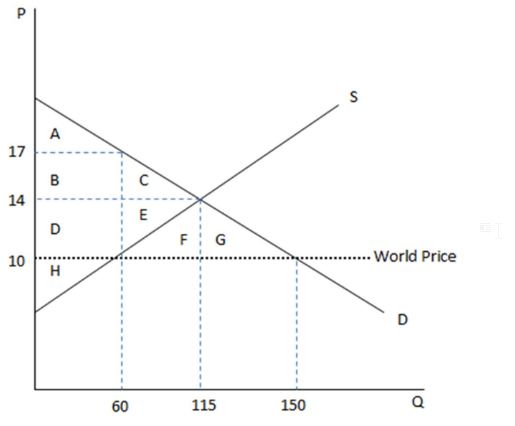
A. increase by 35.
B. increase by 90.
C. decrease by 35.
D. decrease by 90.
A. increase by 35.
You might also like to view...
The table above shows the labor market for the country of Pickett. When the labor market is in equilibrium, the real wage rate is ________ and ________ of labor a year are employed
A) any value less than $25 an hour; any value greater than 40 billion hours B) any value greater than $30 an hour; any value more than 40 billion hours C) any value greater than or equal to $25 an hour; any value less than 40 billion hours D) $30 an hour; 40 billion hours
A government strong enough to protect individual rights is also strong enough to violate them
a. True b. False
Refer to the game between James and Theodore depicted in Figure 12.2. Which of the following is true?

A. If James chooses Up, Theodore's best response is to choose Left.
B. If James chooses Down, Theodore's best response is to choose Left.
C. If Theodore chooses Left, James's best response is to choose Down.
D. If Theodore chooses Right, James's best response is to choose Up.
Suppose that flu shots create a positive externality equal to $12 per shot. What is the relationship between the equilibrium quantity and the socially optimal quantity of flu shots produced?
a. They are equal. b. The equilibrium quantity is greater than the socially optimal quantity. c. The equilibrium quantity is less than the socially optimal quantity. d. There is not enough information to answer the question.